Did you know that tags play a crucial role in helping users discover and organize content on digital platforms like YouTube, social media, and online forums? They can help users find videos on specific topics and can even help platforms recommend videos to users based on their interests. But just like any other feature, tags can also be abused and misused. In fact, YouTube has a policy against misleading metadata, and using irrelevant tags on a video is a violation of the platform's terms of service.
Unfortunately, tag abuse has been a longstanding issue in the online community. In 2012, Google even made tags private on YouTube's public pages in an effort to stop some users from "abusing tags by copying them from other videos."
With these in mind, we are more interested in finding out:
The data used
The data we acquired comes from the platform “YouTube”, a free video-sharing social network. Data from 2005 until 2019 was extracted and further compiled into a dataset called “YouNiverse”. This dataset provides us with the metadata on videos that are in English, uploaded by anonymous users worldwide.
How do users use the tags?
The dataset includes tags used for each video, and by examining these tags, we may uncover some patterns. Therefore, before trying to find the videos with misused tags, we will first analyze the general behavior of the tags. While doing so, we will try to answer several important questions.
Do people go to great lengths to include tags in their videos?
You might think that adding tags to a video is just a matter of throwing in a few random keywords, but it turns out that most users are actually quite strategic about it. In fact, excluding the small minority of videos that have no tags at all, the vast majority of videos seem to include around 10 tags on average. But don't let that fool you - there are always a few outliers who go above and beyond. Some videos have been found to contain an astounding 60 tags or more! Clearly, some users are willing to go the extra mile when it comes to tagging their content. Now let's look at how the average number of tags per video each year:
In 2005, the average number of tags per video was a modest 12. But over the next few years, the trend began to shift. By 2012, that number had skyrocketed to a peak of 17 tags per video. And even beyond 2012, the graph shows that people consistently added more or less 15 tags in their video.
How do tags evolve and die?
We now know that people indeed use tags regularly, but does each tag is used consistently? We might investigate how long tags are used in the environment of YouTube.
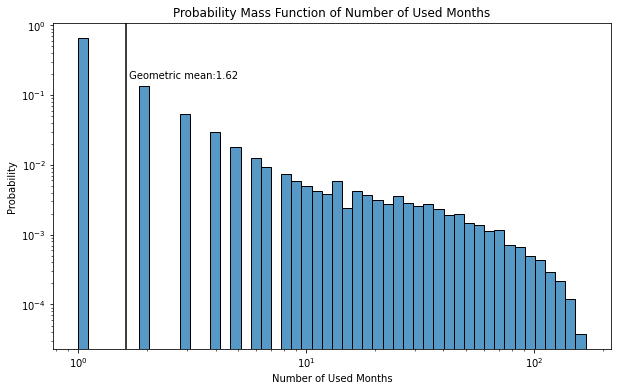
In this analysis, we would like to observe if there lies a common pattern in the trajectories of these tags: do most tags have common lifespan before their usage drops? Let’s find out by plotting the probability mass function of the number of consecutive months tags are used:
From the plot above, we can see that the average lifespan of a tag is one month and that YouTube is a highly dynamic platform. In other words, numerous tags emerge over time but most of them die down after a month. There are, however, cases where the tags’ lifespans exceed more than 10 months to 100 months such. Moreover, the histogram shows somewhat a linear relationship in log-log scale with some outliers towards higher number of months. This suggests that the lifespan of tags might have a power-law pattern.
Some tags even show a periodic usage pattern with peaks in periods where they get relevant:
Plots show that the tag "halloween" is used frequently in October and the tag "olympics" is used in summer of 2012 and 2016, corresponding to summer Olympics, and in winter 2014, corresponding to the winter Olympics.
What about popular tags?
Given we have information on the usage of tags, one natural question is whether we can observe popularity based on these usages.
The analysis can be carried out to identify "popular" tags that show sudden increase in their usage, that is, the number of videos containing the tag. We use the concept of Z-score in statistics on tag usages to detect sudden changes in the usage patterns. Z-score take into account the historical average and also the standard deviation of the historical data, making it more suitable than just observing the average usage. With this calculation, large Z-scores show sudden increases while small Z-scores show small changes in tag usage. Our approach consists of several steps:
For each month:
Filtering less used tags: tags that are used less than the 90th percentile of tag usage in the given month are filtered out. This step allows us to eliminate the tags that are used in few videos as we want to find popular tags that are both used more compared to their previous usages and also used enough to be considered popular.
Z-score calculation: all the Z-scores of the tags are calculated with standardization by subtracting the historical mean and dividing by the historical standard deviation. If the tag is introduced in the current month, average and the standard deviation of all previous usages of all tags in previous months is used instead.
Ranking the Z-score: Tags with highest Z-scores are identified as popular tags in the given month.
Let’s see if we see recognize some popular tags that coincide with real life events:
Categories
The timeline shows some topics that were internationally known or were related to a global phenomena – such as Hurricane Sandy that hit New Jersey back in October 2012 and the release of the film Harry Potter and the Deathly Hallows in November 2010. This analysis show that some popular tags are indeed related to real life events.
How long does popularity last?
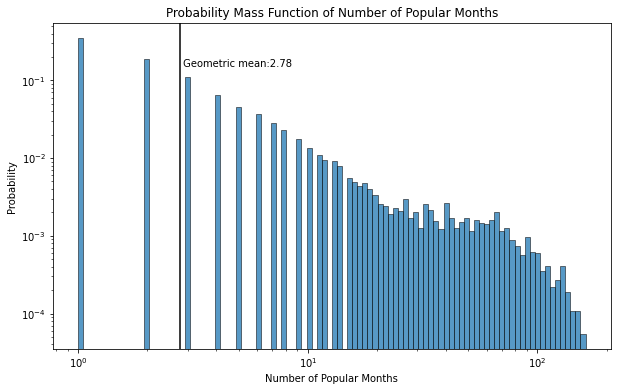
We now investigate how long these tags remain popular before starting to lose interest. We visualized the histogram of the number of months the Z-scores of remain positive for all popular tags:
The geometric mean we calculated was 2.78 months, which means that trends represented by tags in YouTube videos change very fast, similar to the lifespan of general population.
Next, we investigate popularity length for each category:
Most of the popularity periods range from 2 to 3 months; with 2.37 months (Travel & Events) being the shortest, while the longest is 3.87 months (Gaming). It seems that the longevity of a topic varies in different categories/industries.
How do clusters of tags that are used together behave temporally?
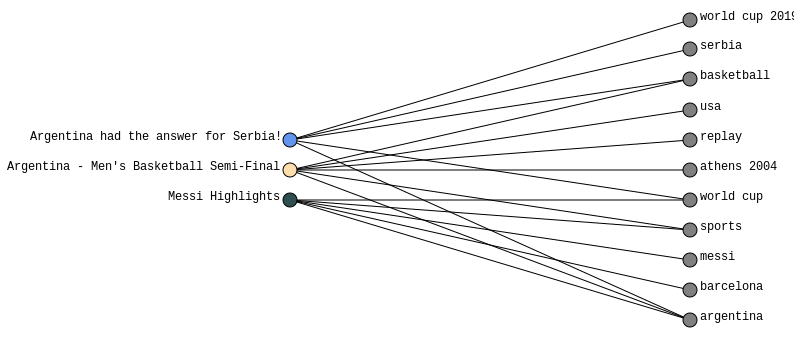
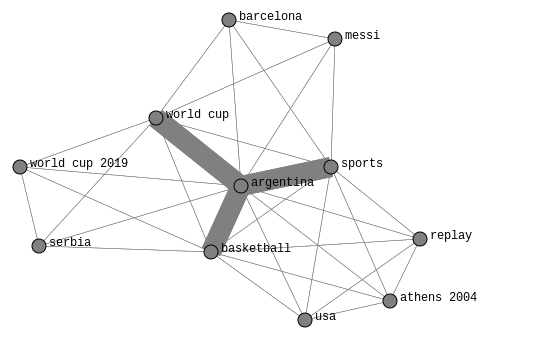
We analyzed the tags separately until now, but tags that are used together in a video may also reveal some important insights. We can interpret the tag-video pairs
as a bipartite graph, with tags on one side and videos on the other. Here is a small example
from "Sports" category where videos are connected by the tag "argentina".
From this bipartite graph, with a projection, we can observe the network between tags where the weights represent how many videos two tags were used together.
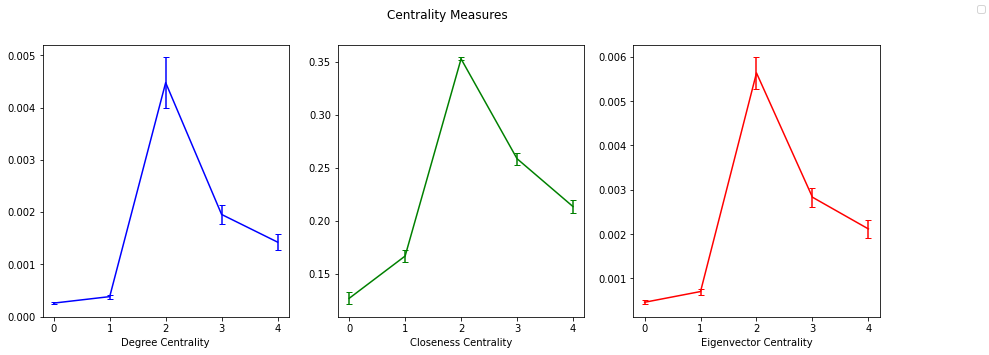
Even on this a small example, we can see that "argentina" provides more information about the network than others. Can we generalize this observation to see if we can detect a pattern between popularity and tag networks? Does popular tags also gain importance the month they were detected as popular? Luckily, we have measures to check the importance of nodes in a network: "centrality". We calculate three centrality measures of the popular tags we identified, in a five month timeframe with the popularity month at the center.
We indeed see an increase in all three centrality measures in the popularity month. So, popular tags do get more important in the tag network when they are popular.
Now that we have a general understanding of the tags, let's return to the question of misuse.
Do people misuse video tags on unrelated video categories to exploit trending topics?
Although YouTube claims that tags are not a significant factor in the video recommendation algorithm, users might still use tags related to popular events with the hopes of gaining more views. We now investigate this claim in a case study - Trump's election in November 2016.
We previously identified that tags related to Trump such as "#trump2016" and "trump cabinet" were popular in the election period in 2016. Given that misuse is related to the video content, we assume that the title represents the content of the video and therefore we take advantage of the titles of the videos in our analysis. The first thing that comes to mind may be to check the presence of the word "Trump" in the title, however, this would not take us further as videos with titles not containing Trump may still be relevant, such as "Meet Up Details / Feelings about New President!". To tackle this problem, we first find the most related tags with the tag "trump", and use those as a hint of relevance.
In order to identify the tags that are most closely related to "trump" among the 13,321 tags used with "trump" in the "News & Politics" category in November 2016, we used a metric similar to pointwise mutual information (PMI) without considering the usage of tag trump given it is equal among all tags. By applying the filtering method, that is explained below, we were able to reduce the number of related tags to 176. The following tags had the highest ratio according to our approach, which means that they are often used together with the tag “trump”:
To calculate the ratio:
We filter out the tags whose usage is less than 90% of the population. With this approach, we only get tags that are used by many people on many videos.
For each tag we find the number of videos it is used. num_used
For each tag we find the number of videos it is used with the tag "trump", num_used_trump.
Ratio = num_used_trump / num_used * 100
We take the tags with length>2 and with ratio>0.5
For the relevant tags to be representative of the whole category, we eliminate the tags that are not in the first 90 percentile of usage and therefore not commonly used. For example, if Trump supporter Alicia uses the tags “trump” and “alicia loves trump” on all her videos, this would result in ratio of 100% but would not be the tag type we are interested in. This approach also helps us exclude tags with typos, given they are unlikely to be used commonly.
The threshold we set for selecting tags will impact the number of related tags we find. For our analysis, we wanted to focus on precision by selecting a low threshold and be sure that the suspected videos indeed show misuse.
The remaining tags represent keywords that tend to be used together with our tag of interest – “trump”. Using these tags, we check if we can find misused examples in other categories. For every category other than “News & Politics”, we extract all the videos that are tagged with “trump” in a 5-month timeframe, between September 2016 and January 2017. We chose this time frame as it corresponds to the election period, where Trump and Clinton were the talk of the town. We then inspect whether these videos contained the related keywords (the remaining tags mentioned before). The number of videos that contains both the keyword and the tag “trump’ can be found below:
With Tag Trump
URGENT: OBAMA JUST STARTED NEW COLD WAR WITH RUSSIA! THIS IS REALLY BAD
10 McDonald's Happy Meals Challenge
Why a 1000 x TRUMP and not HILLARY
Related Tags in Title
Meet Up Details / Feelings about New President!
An Event in the Life of: Election Day - Trump Supporter?
Go Vote! 30% - 40% of Gun Owners Don't Vote (VOTE FOR ME!)
Related Tags not in Title
Tackle-Buster Gator Bluefish!
JUJU ON THAT BEAT CHALLENGE!
REMOVED From Web! UFO Fleet Over Mexico Border 1/26/17
Trump in Title
Donald Trump Calls Indian Tech Support Scammers
Is Donald Trump the Republican Party's New Christ?
Donald Trump vs Hillary Clinton. Epic Rap Battles of History | REACTION!!!
To check if the videos that do not contain these tag pairs are misused, we sample around 20% of the videos tagged with “trump” and perform manual checks to determine if the usage of tags in these videos are appropriate.
Given 613 randomly selected videos, we labeled them as either Misuse, Related or N/A. Videos that were no longer available or that were not in English were labeled as N/A. Results for each category can be seen on the following charts:
Among all randomly selected videos, 59.2% were labeled as misuse, 19.6% as Related and 21.2% as N/A. If we exclude N/A, 75.2% of the videos would fall under the category of misuse. Sports category for example has a misuse rate of 84.2%, which can be considered high. These scores validate the capabilities of our approach and verify that we can infer the misuse to some degree.
You might assume that only small-time video creators are guilty of misusing tags in order to attract more viewers. But hold on to your seat belts, because we discovered that even the official Mercedes F1 Team’s channel has jumped on the tag misuse bandwagon! In fact, they’ve misused the tag “trump” not just once, but multiple times. For instance, check out this video where they paired “trump” with another highly misused tag – “christmas”. Talk about a wild ride!
Next, we’ll see if the percentage of tag misuse changes over time.
The graph shows a slight drop in October 2016 and January 2017, but peaked in November and December 2016; we can assume that more "trump" tags were misused in these 2 months.
It’s time to put our approach to the test with some different tags. The World Cup is a huge, global event, so let’s see if we can find any examples of misuse. We’ll sample videos from 2018 using the aforementioned approach and check out a few random videos that are labeled as misuse. Get ready for some tag-tastic data!
After a quick manual inspection, we found that most of the titles are unrelated, indeed. However, we did mistakenly label a few titles. Even though it did not come home, video with title "IT'S COMING HOME !!!!!! (Runescape Song)" tricked us. Oops!
Now we have seen that although our approach did manage to detect the misuse of data, there are some limitations of this approach:
Due to human error, we may falsely label the videos as Relevant, even though they are Misuse (false negatives!). If you are talking about Mc Donald’s, feel free to use the tag “trump”.
There are hyperparameters such as percentile and threshold. Since manual labeling was needed, we did not explore so many values, but this can also affect the final result.
Conclusion & Implication
In this work, we analyzed the behavior of tags, focusing on popularity and misuse. We saw that the average number of tags per video has increased over time, and certain tags are used more frequently together than others. We analyzed the interactions of tags with each other and identified tags gaining popularity.
Even though adding excessive tags is against YouTube's policies on spam, deceptive practices and scams, our analysis showed that there is indeed a tag misuse problem. It has been found that tags on YouTube can be misused in order to manipulate the visibility of a video or to exploit trending topics. Given our data is not up-to-date, the validity of this claim should be investigated further for the current behavior of the users.